Understanding Report Output
The emailed reports display “Finance Report” in their header. This is the same output generated by custom reports — the terms refer to the same thing.
When a custom report is delivered, you receive an email containing a summary header and one or more report tables — depending on the groupings you selected. This page walks through what to expect.
Email structure
Every report email contains:
- Report title — the show name and “Finance Report”
- Date range — the transaction or performance period covered
- Filter summary — a reminder of the filters used to generate this report (retailers, statuses, date ranges)
- Report tables — one table per grouping you selected (e.g. “Sales by Ticket” and “Sales by Transaction Date”)
- Attachments — CSV and/or PDF files depending on your format selection
If your report doesn’t look right or the numbers don’t match what you expect, check the filter summary first. Different filter combinations produce different results — the most common cause of discrepancies is comparing reports built with different filters.
Sales by Ticket
When grouped by ticket, each row represents a single ticket. This is the most granular view.
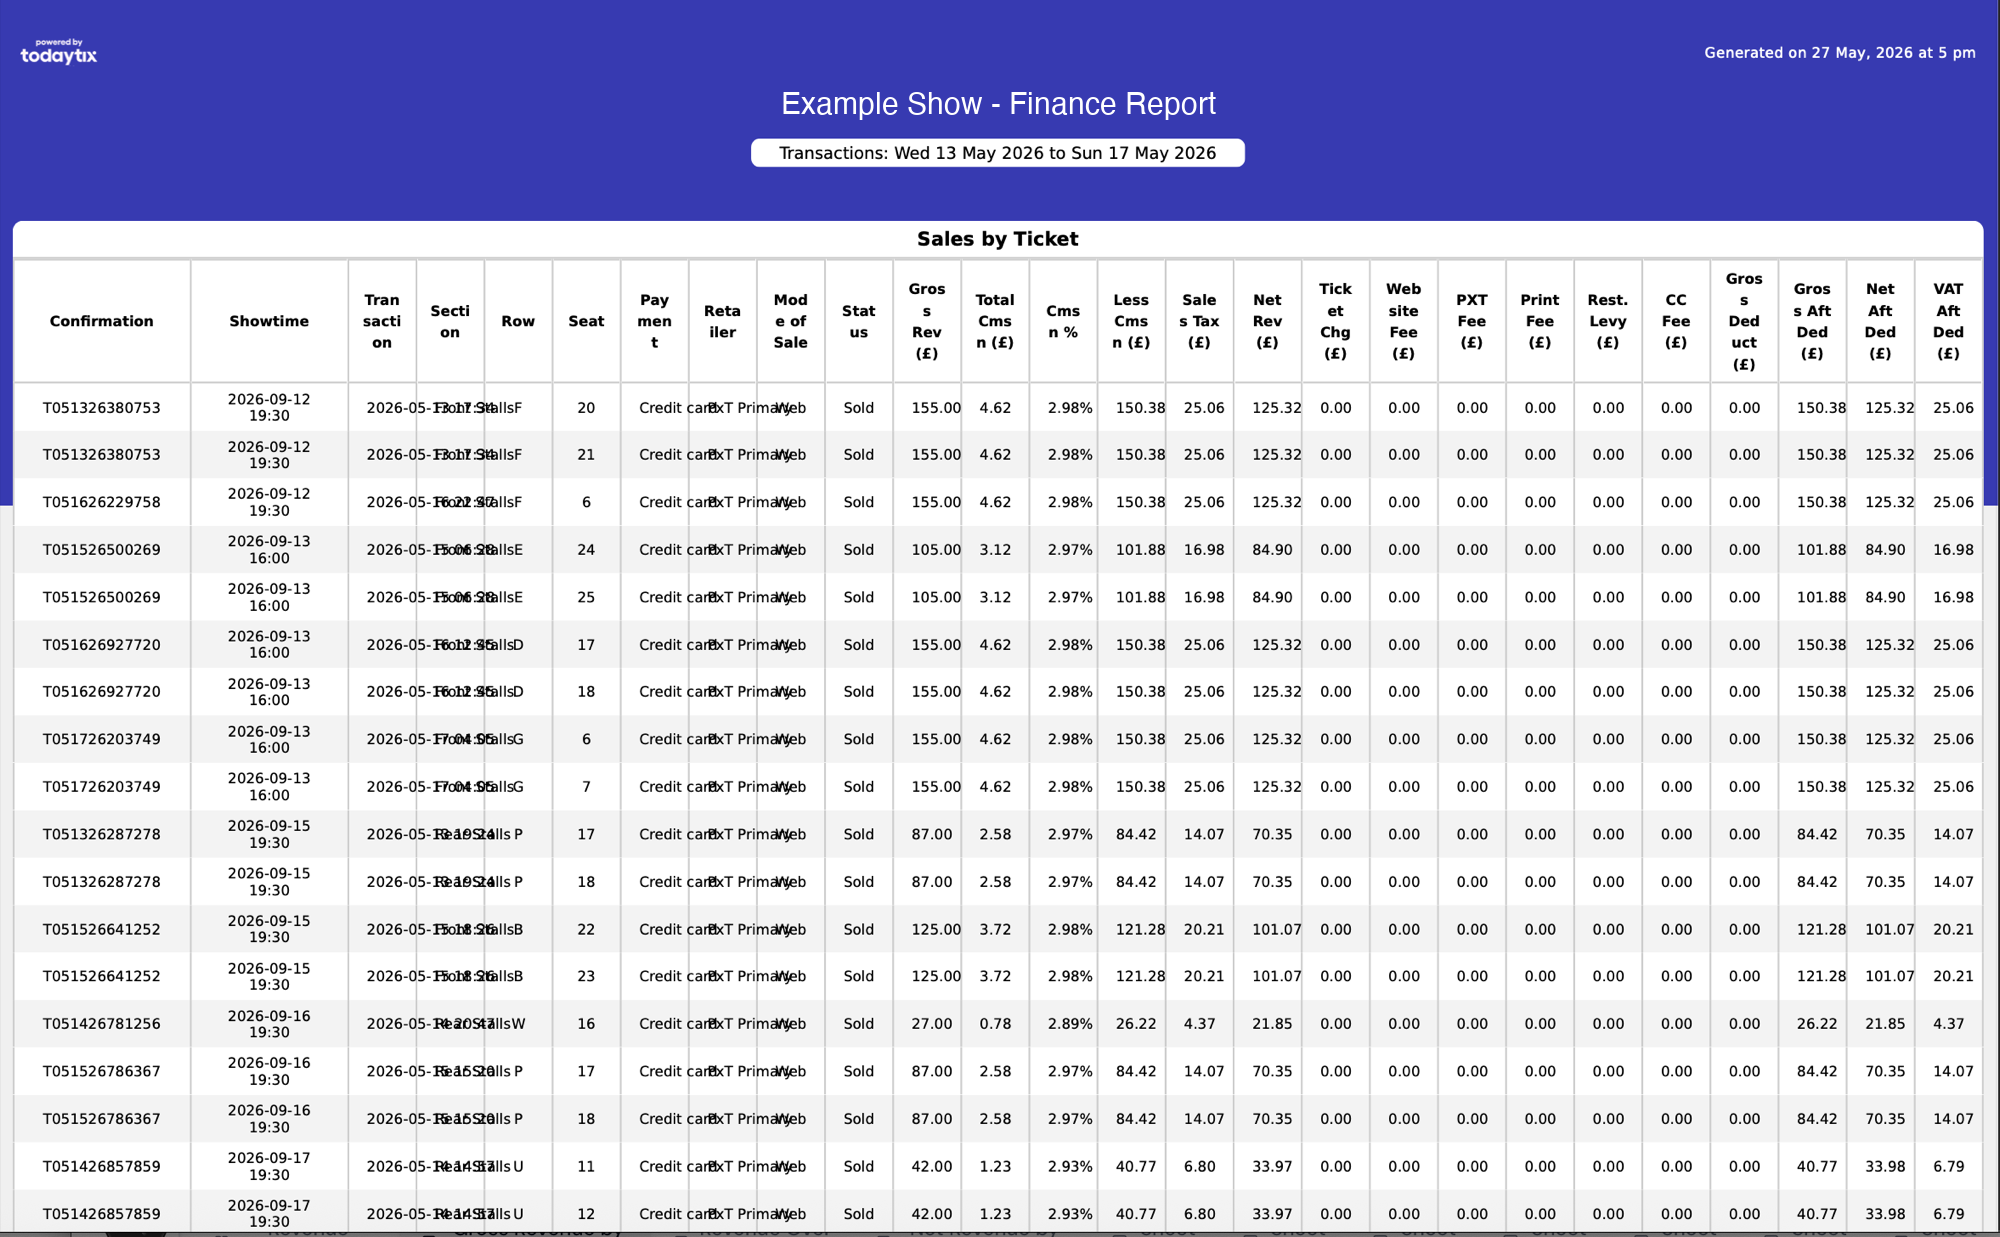
Each row includes:
- Confirmation — the unique confirmation number
- Showtime — the performance date and time
- Section / Row / Seat — the seat location
- Payment type — how the ticket was paid for (credit card, voucher, account, etc.)
- Retailer — which retailer (e.g. ticket agent) made the sale
- Status — Sold or Returned
- Financial columns — from Gross Revenue through to Net After Deductions (see Report Column Reference)
This view is best for:
- Auditing individual transactions
- Tracing a specific refund back to its original sale
- Checking order details for a particular confirmation number
The CSV version of this report contains the same data in a flat spreadsheet format, suitable for pivot tables and further analysis.
Sales by Transaction Date
When grouped by transaction date, each row represents one day’s worth of transactions.
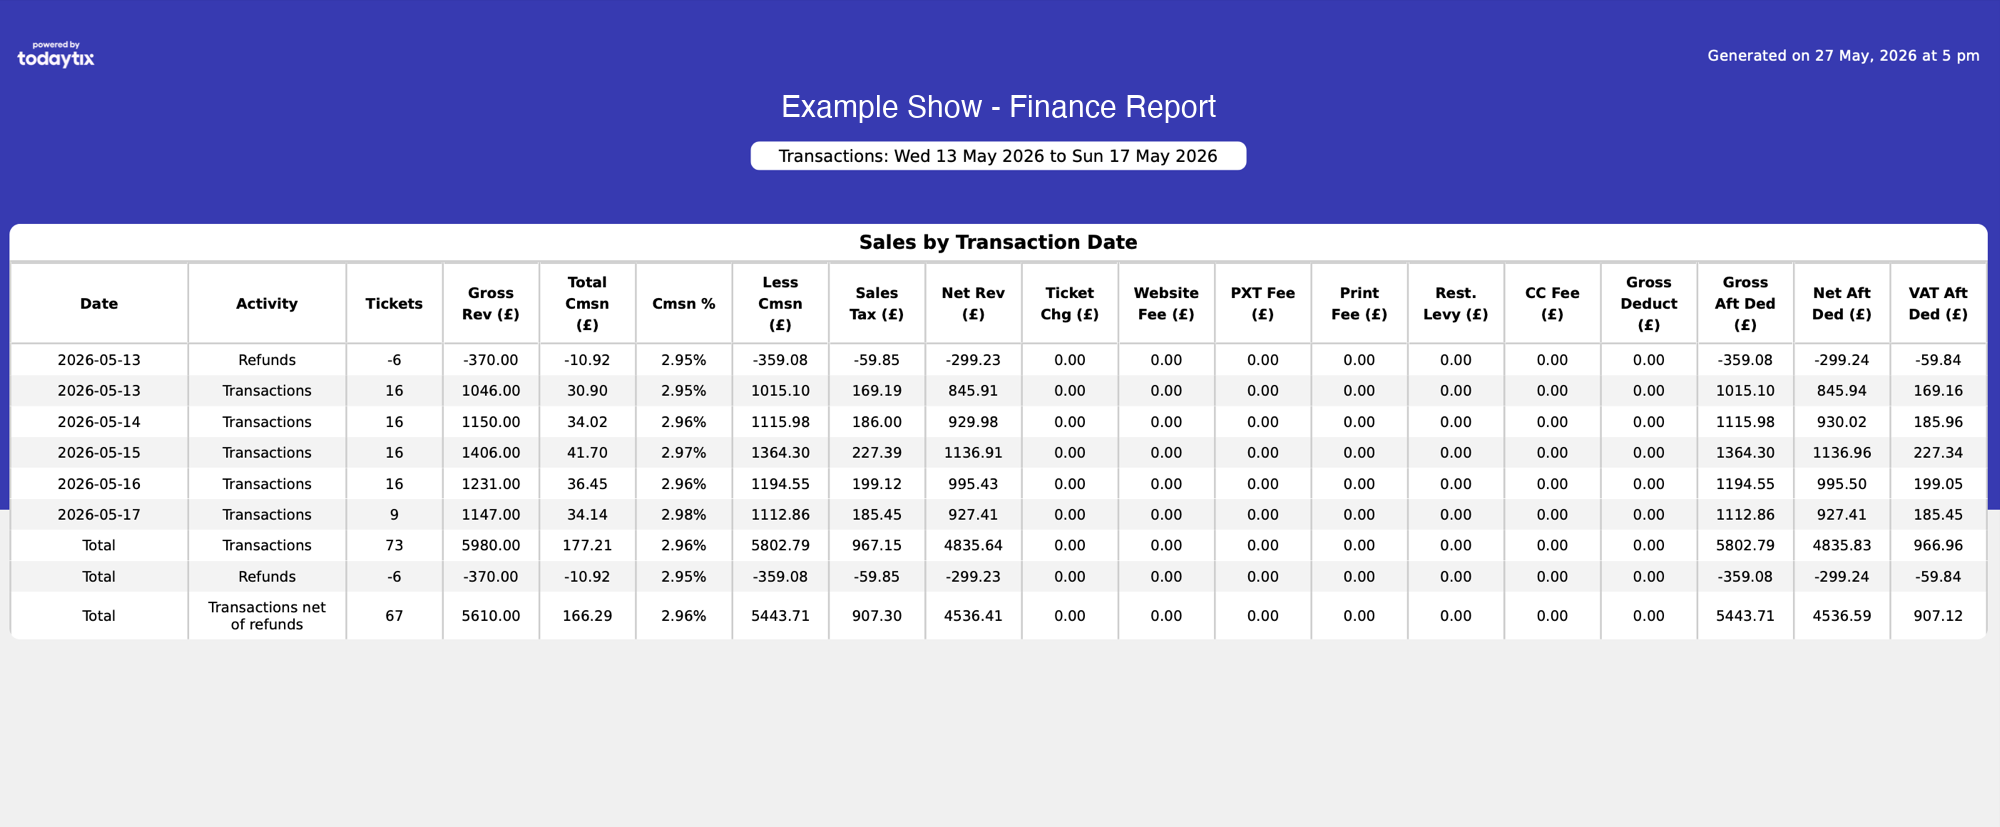
Each row includes:
- Date — the transaction date
- Activity — Transactions or Refunds
- Tickets — number of tickets (negative for refunds)
- Financial columns — Gross Revenue, Commission, Sales Tax, Net Revenue, and all fee deductions
The bottom of the report shows:
This view is best for:
- Reconciling daily bank deposits
- Tracking sales trends over time
- Producing weekly summaries for finance teams
Sales by Performance
When grouped by performance, each row represents a single performance. This view is not shown in the screenshots above but follows the same structure, with each row showing:
- Showtime — the performance date and time
- Tickets — number of tickets for that performance
- Financial columns — from Gross Revenue through to Net After Deductions
Transactions and refunds are split into separate rows for the same performance, so you can see both the gross sales and any refunds for each show.
This view is best for:
- Comparing revenue across performances
- Identifying strong and weak performances
- Understanding advance order patterns
CSV vs PDF
Both formats contain the same underlying data. The PDF includes visual formatting (headers, borders, branding) while the CSV is raw data.
Next steps
- Report Column Reference — detailed explanation of every column
- Creating Reports — build a new report
- Invoicing — sending invoices to retailers