
Email Attachments
Powered by TodayTix provides automated sales reporting for every event on the platform. Reports are delivered by email and updated in the partner portal, so you always have a reliable picture of how your event is performing — without manual data pulls or spreadsheets.
Every email report includes PDF and CSV attachments that go deeper than the email body. Where the email gives you a snapshot, the attachments answer the follow-up questions: why was the circle empty last night? How many tickets were sold at the lowest price band? Which agents are driving the most volume? The PDF is a formatted, branded document you can share directly with stakeholders. The CSV contains identical data in a flat spreadsheet format for analysis in Excel, Google Sheets, or any BI tool.
Use the attachments to:
- Answer specific questions — drill into exactly why a performance looked the way it did, broken down by price, section, channel, agent, and offer type
- Prepare for meetings — print the PDF or share it on screen during your marketing and sales reviews
- Understand audience composition — see how your ticket sales distribute across price bands, seating sections, sales channels, and offer types
- Feed into existing workflows — import the CSV into your pivot tables, Tableau, Power BI, or other analytics tools
Showtime breakdown
Attached to both the after-showtime email and the morning email. Each performance gets its own PDF and CSV — so an event with a matinee and evening performance will have four attachments (two per format).
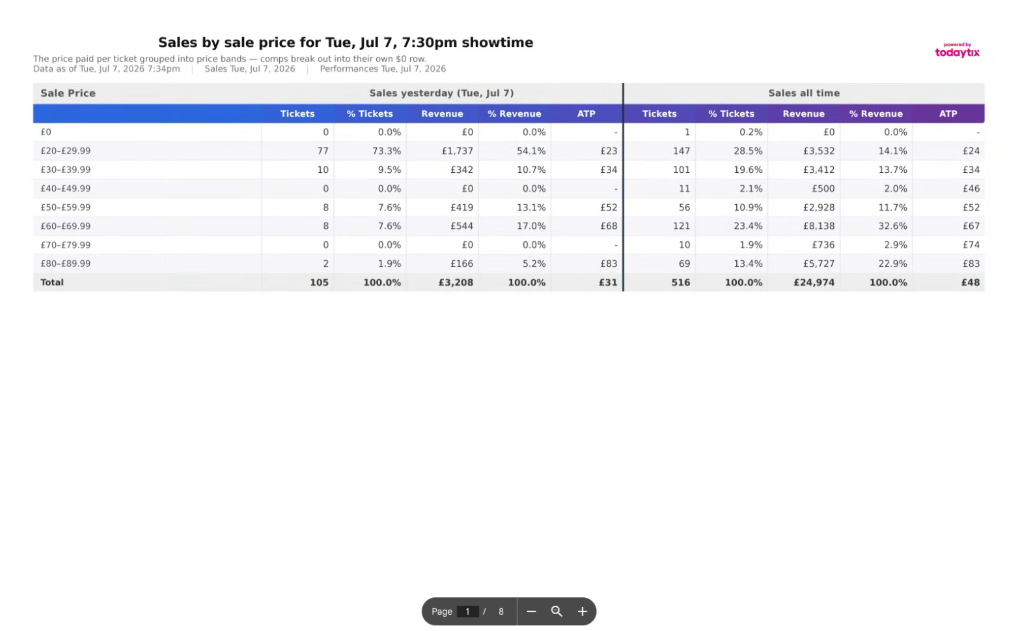
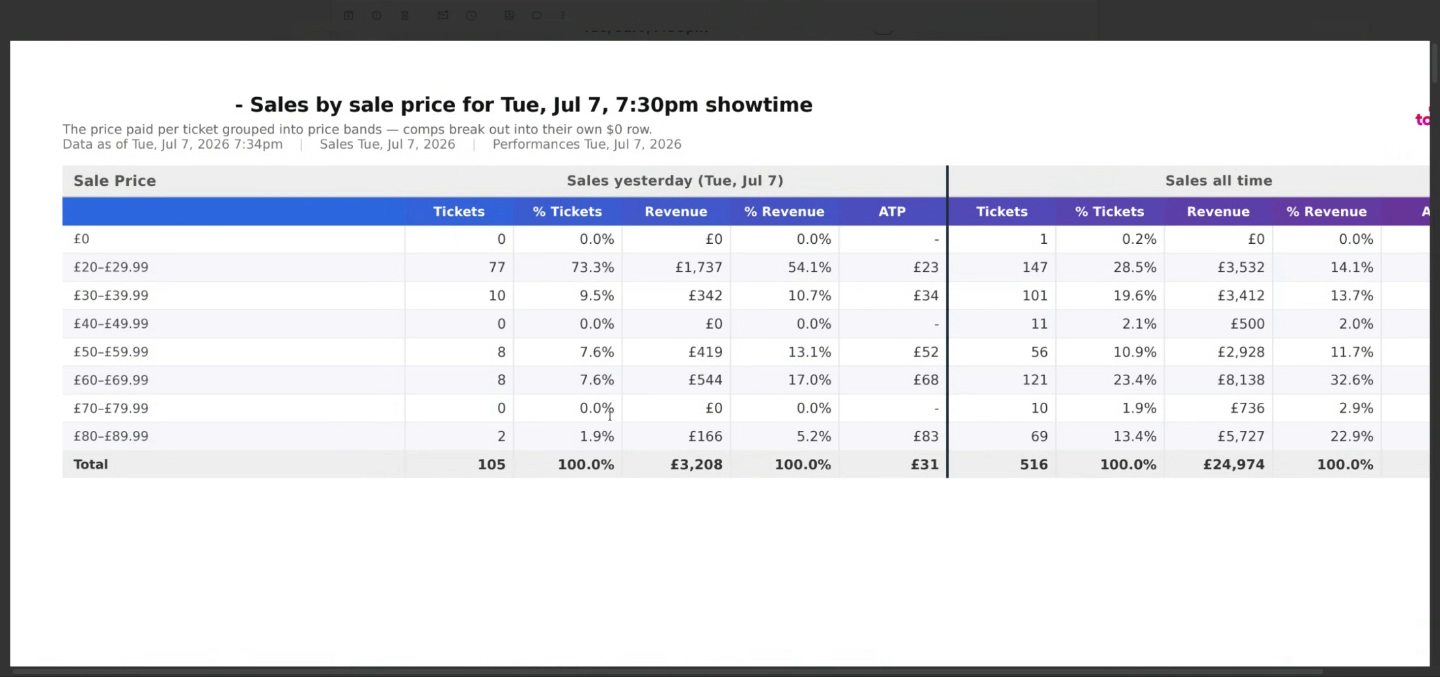
The showtime breakdown takes a single performance and slices the ticket data by eight different dimensions, giving a complete picture of who bought tickets, at what price, through which channel, and in which part of the venue.
Breakdown pages
Every page includes two sets of columns:
- Sales yesterday (or sales on the performance date) — tickets and revenue for the most recent transactions
- Sales all time — cumulative tickets and revenue since the performance went on sale
Sale prices shown in the breakdown are excluding outside fees — they reflect the event’s ticket price, not the total amount charged to the customer.
Transaction breakdown
Attached to the morning email only. While the showtime breakdown slices data by performance (what happened at a specific showtime), the transaction breakdown slices data by transaction date (what was sold on a given day). This means it includes tickets purchased yesterday for any future performance — not just yesterday’s shows.
The format is identical to the showtime breakdown: the same eight pages, the same columns, the same PDF and CSV formats. The only difference is the perspective — performance date versus transaction date. You may find this view more useful for understanding daily commercial activity, while the showtime breakdown is more useful for understanding audience composition at a specific performance.
Sales by Showtime
Attached to the morning email only. This is a single table listing every performance — past and upcoming — with a comprehensive set of metrics per row. It is the most complete at-a-glance view of an event’s entire run.
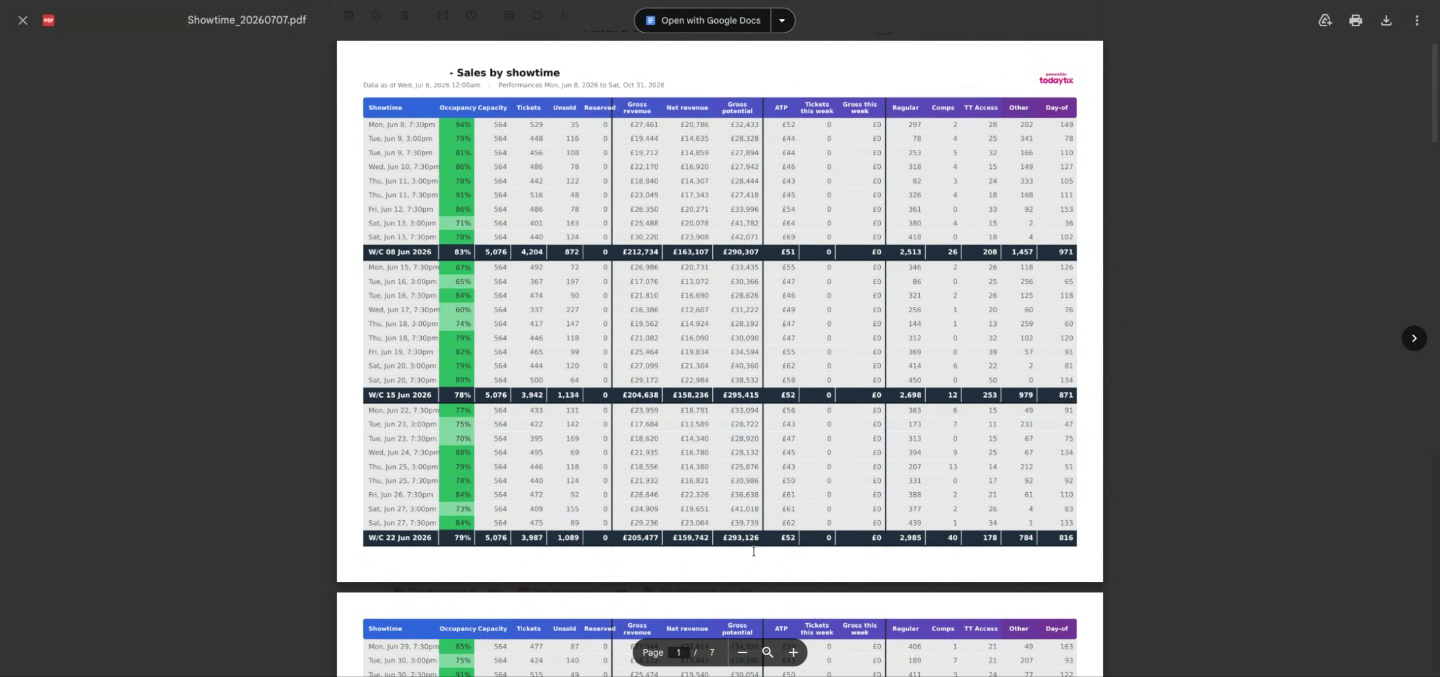
Past performances appear on a gray background; upcoming performances on white. A small indicator marks the next performance. Performances are grouped by week, with subtotal rows showing weekly aggregates — making it easy to spot week-on-week trends.
Columns
Ticket type breakdown
The final columns split purchased tickets by type:
Color coding
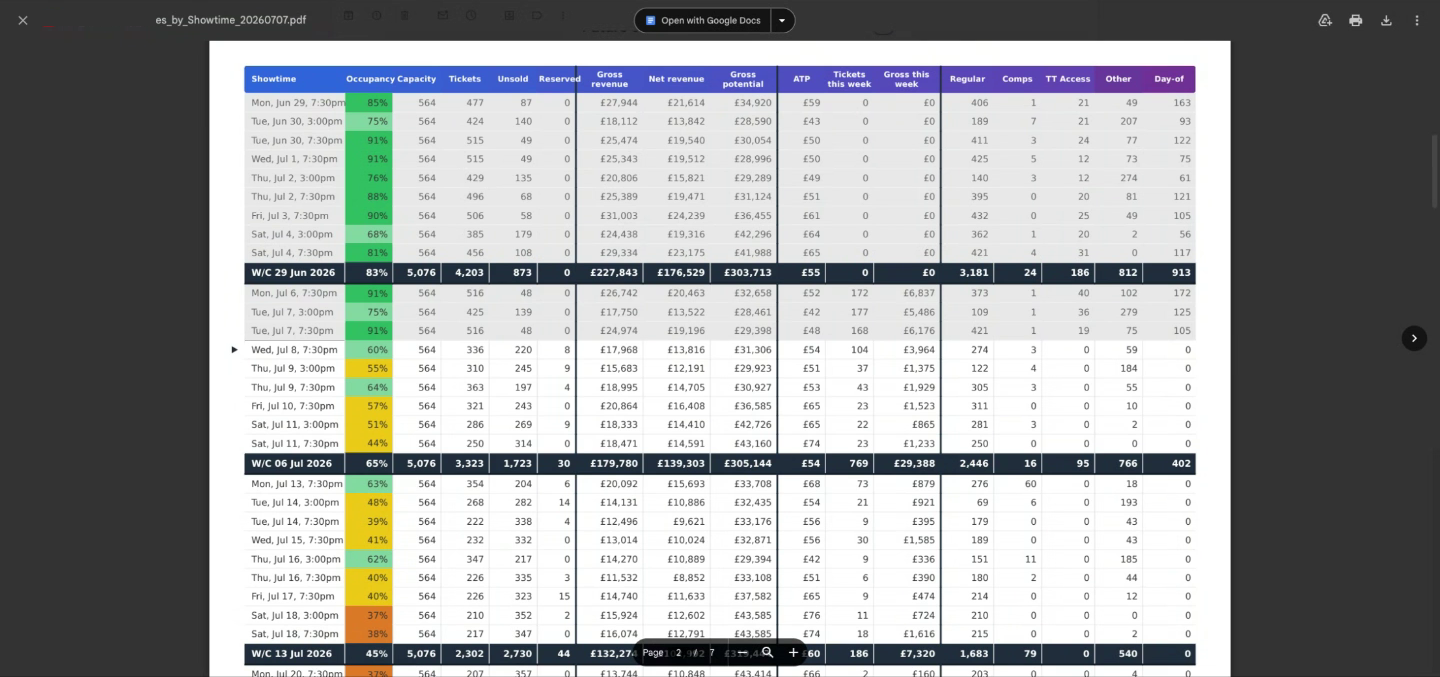
Each performance row is color-coded on a five-tier scale to immediately highlight where attention is needed. The scale is relative — colors are assigned based on where each performance’s occupancy falls between the lowest and highest occupancy across all performances in the report.
Next steps
- After-Showtime Email — understand the per-performance email sent 30 minutes after curtain
- Morning Email — the daily digest that consolidates showtimes, sales, and future showtimes
- Sales Calendar — explore the same data interactively in the portal
- Creating Custom Reports — build reports with custom filters and groupings