Creating Custom Reports
Custom reports give producers, ticketing managers, marketing teams, and anyone else working on a show granular visibility into their sales data. You choose the date ranges, the performances, the retailers, and the level of detail — then receive the report by email on whatever schedule you need.
Use custom reports to:
- Understand sales patterns — see how revenue breaks down by performance, by day, or by individual ticket
- Reconcile finances — match transactions against bank deposits, audit refunds, and track commission deductions
- Feed external BI tools — export as CSV and plug directly into Excel, Tableau, Power BI, or any other analytics platform for further visualisation and analysis
- Keep stakeholders informed — schedule recurring reports so your team (or your retailers, e.g. ticket agents) get regular updates without manual work
Prerequisites
- A partner portal account at portal.poweredbytodaytix.com
- At least one show on sale
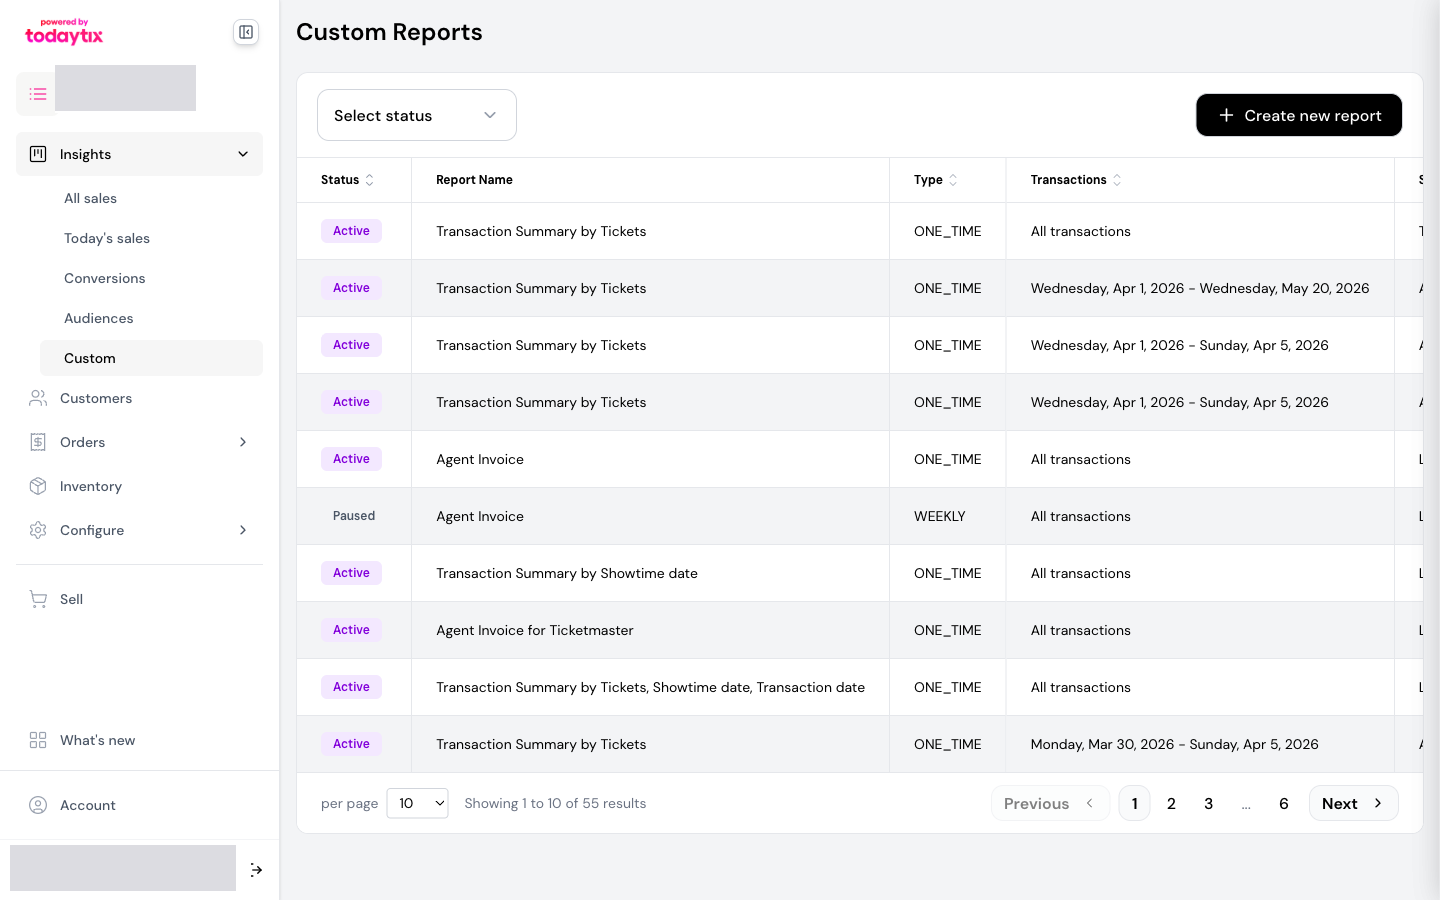
Open the report builder
- Log in to the partner portal.
- Navigate to Insights > Custom in the sidebar.
- Click Create new report.
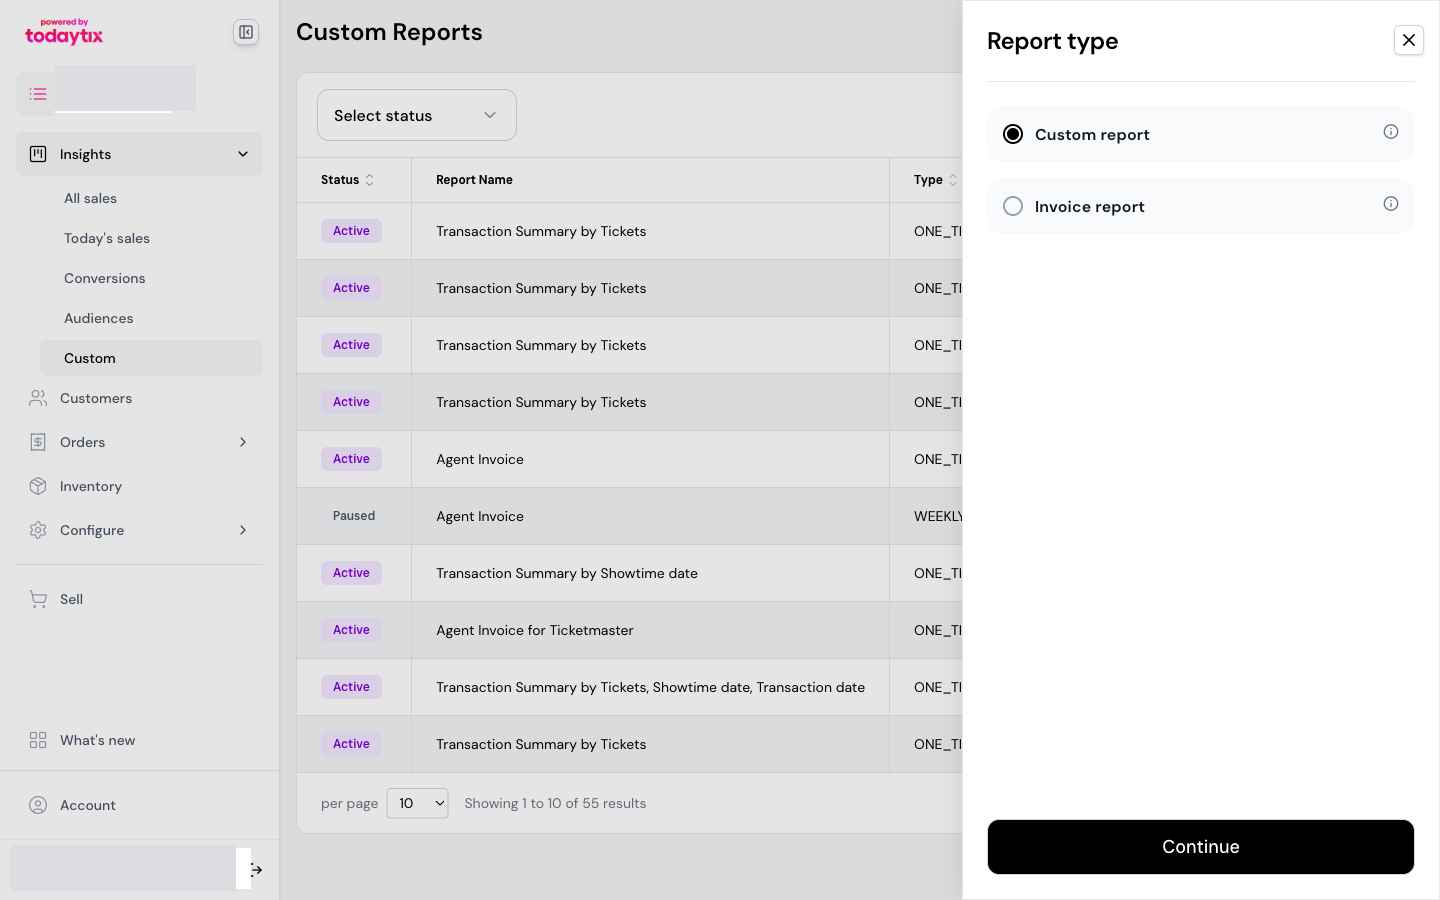
- Select Custom report (not Invoice report — see Invoicing for invoice setup) and click Continue.
The report builder is a 3-step wizard: date parameters, report details, and delivery options.
Step 1: Date parameters
Set up the date parameters for your report. Both the Transactions and Performances sections offer the same three options.
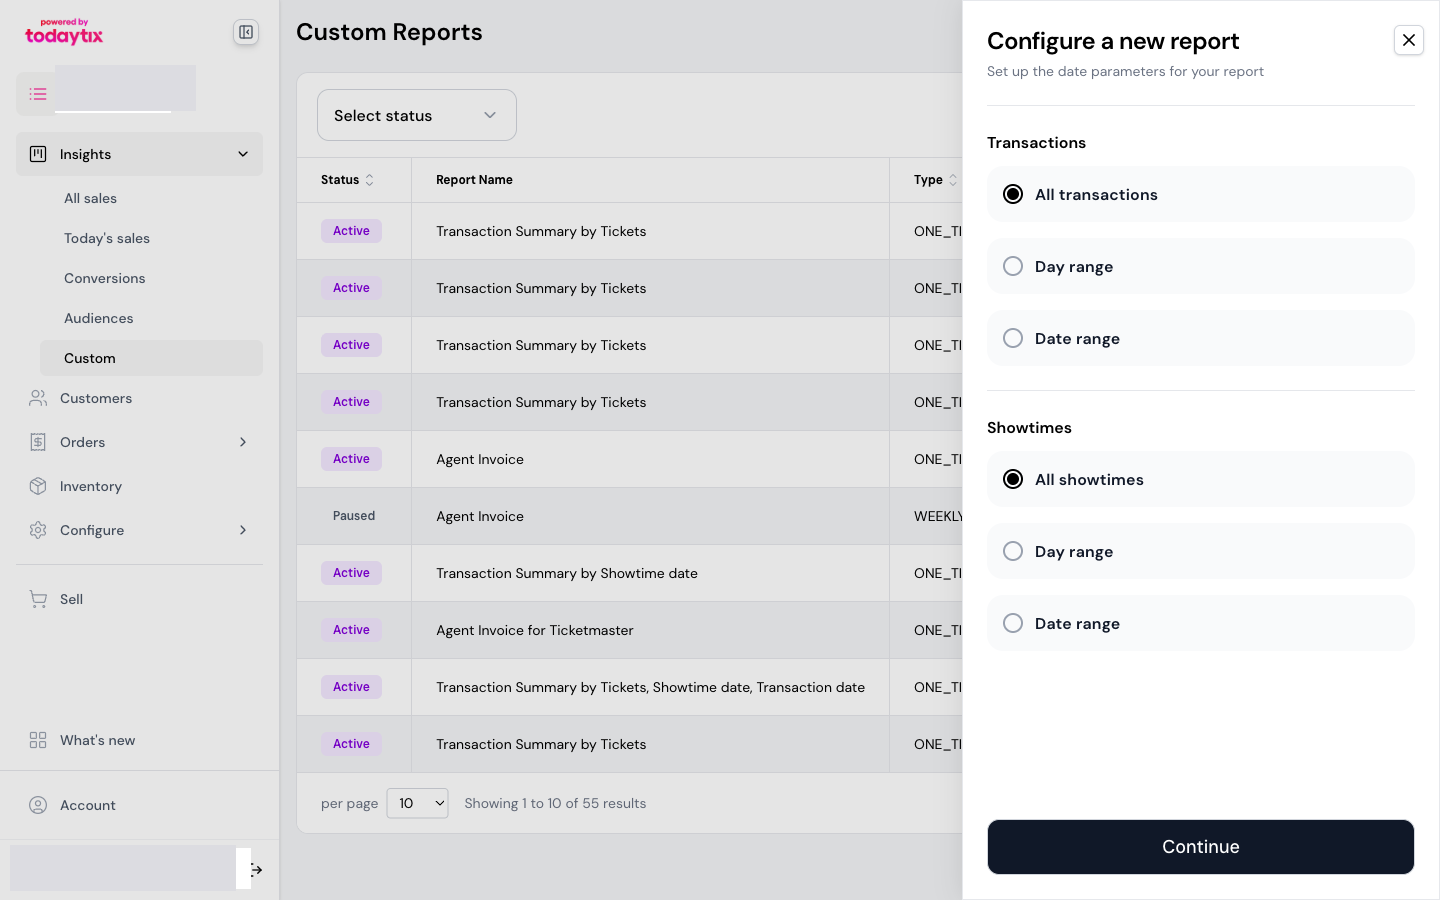
Transactions
Choose which transactions to include based on when they were processed.
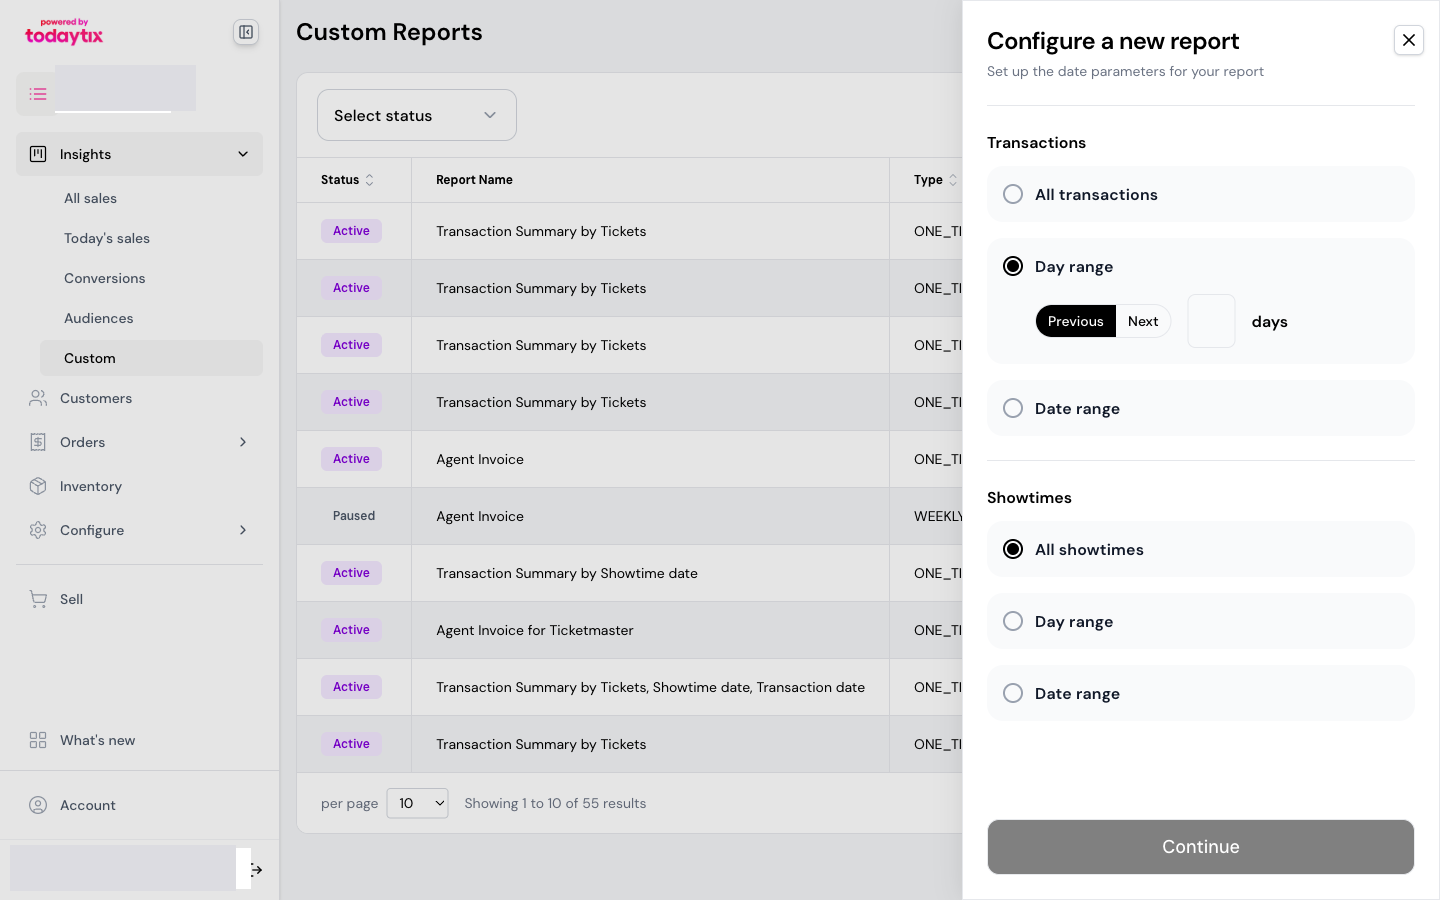
Day range gives you a Previous / Next toggle and a number-of-days input. Choose “Previous” for historical data (e.g. last 7 days of sales) or “Next” for forward-looking data (e.g. upcoming orders).
Date range opens a calendar picker where you select specific start and end dates.
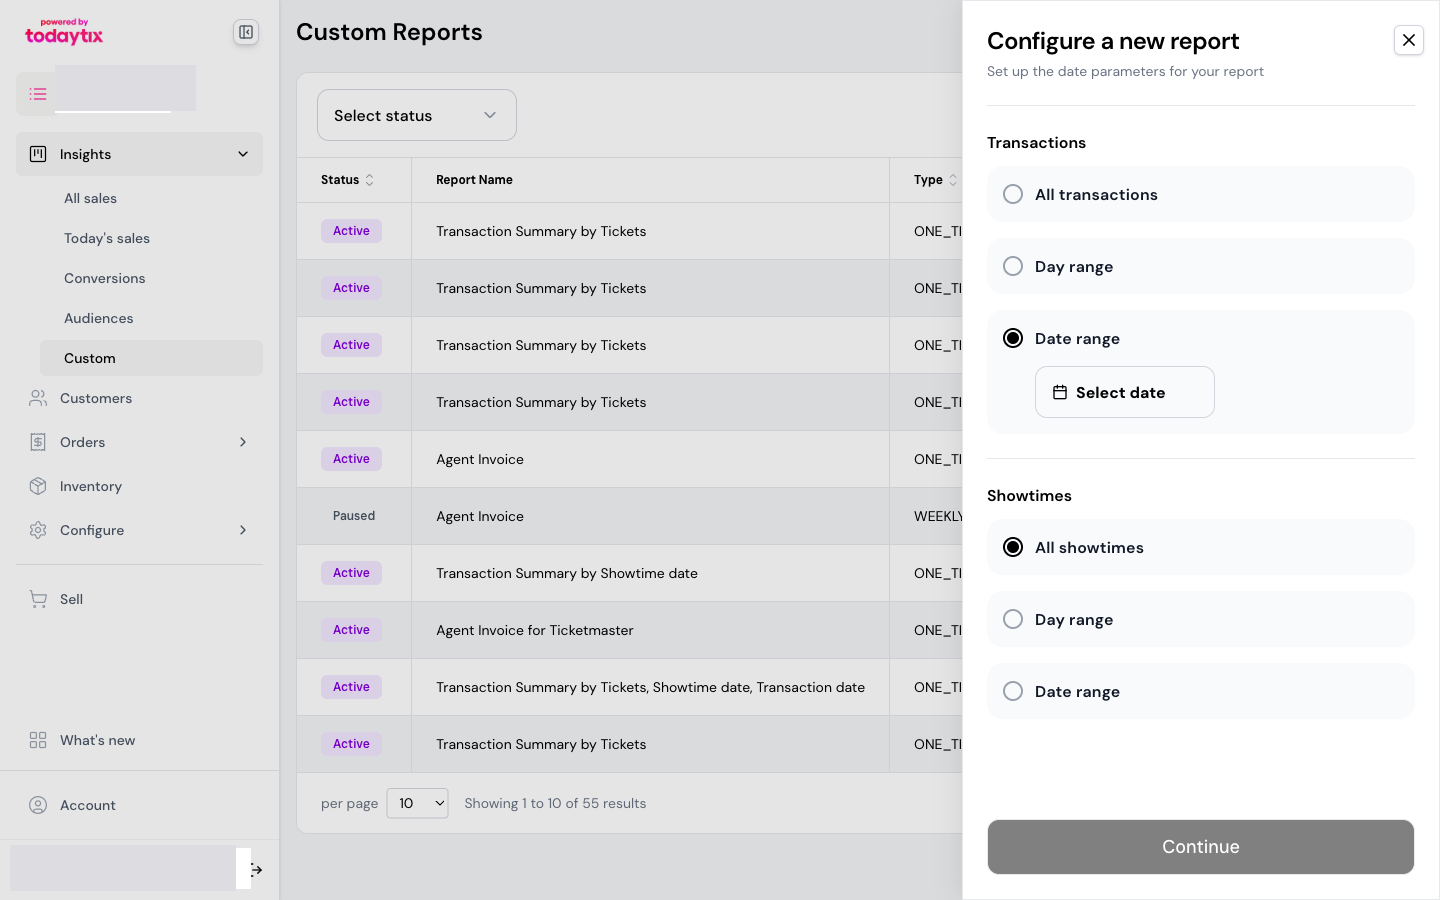
Performances
Choose which performances to include. The options mirror the transaction filters.
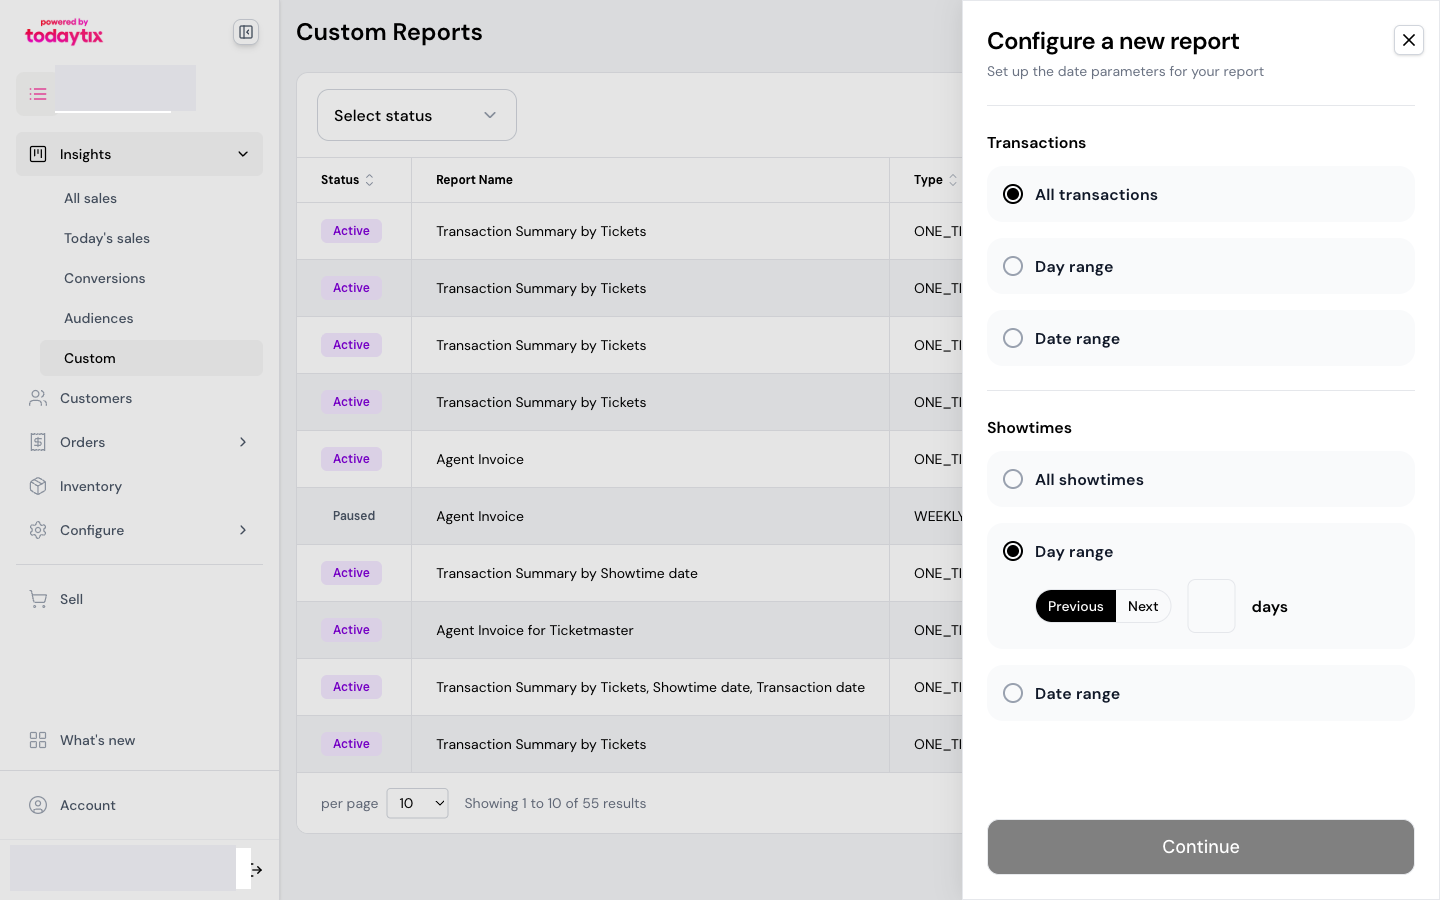
You can combine transaction and performance filters independently. For example: all transactions, but only performances in the next 7 days — useful for checking advance orders.
Transaction dates reflect when each charge or refund was processed — not when the original order was placed. A ticket sold last week and refunded this week will appear in this week’s report as a refund.
If you need to see the full lifecycle of a ticket (sale and refund together), use a date range wide enough to capture both events.
Click Continue to proceed.
Step 2: Report details
Configure the details of your report.
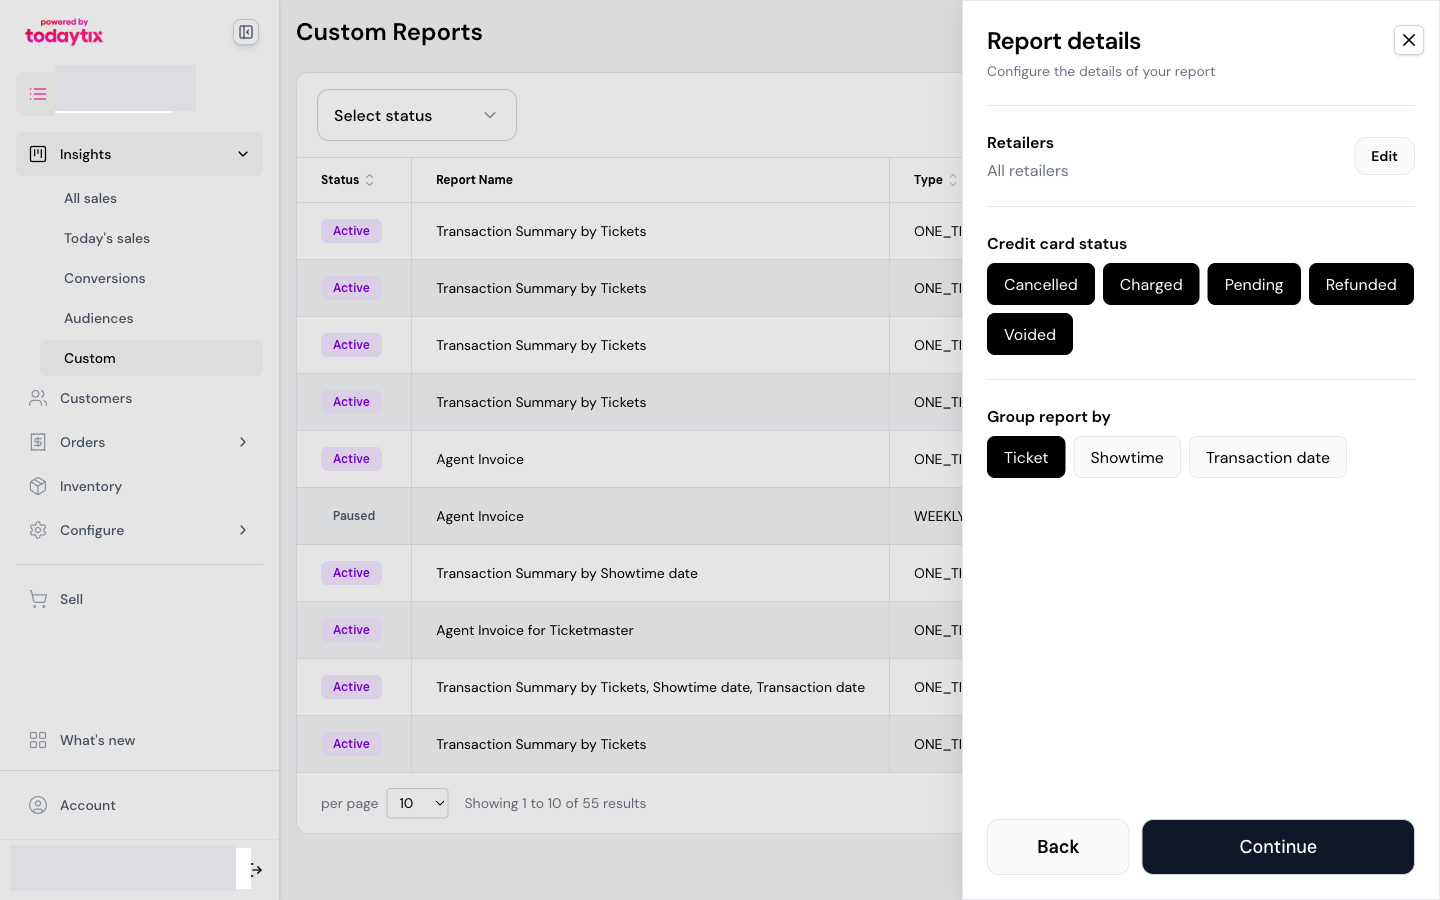
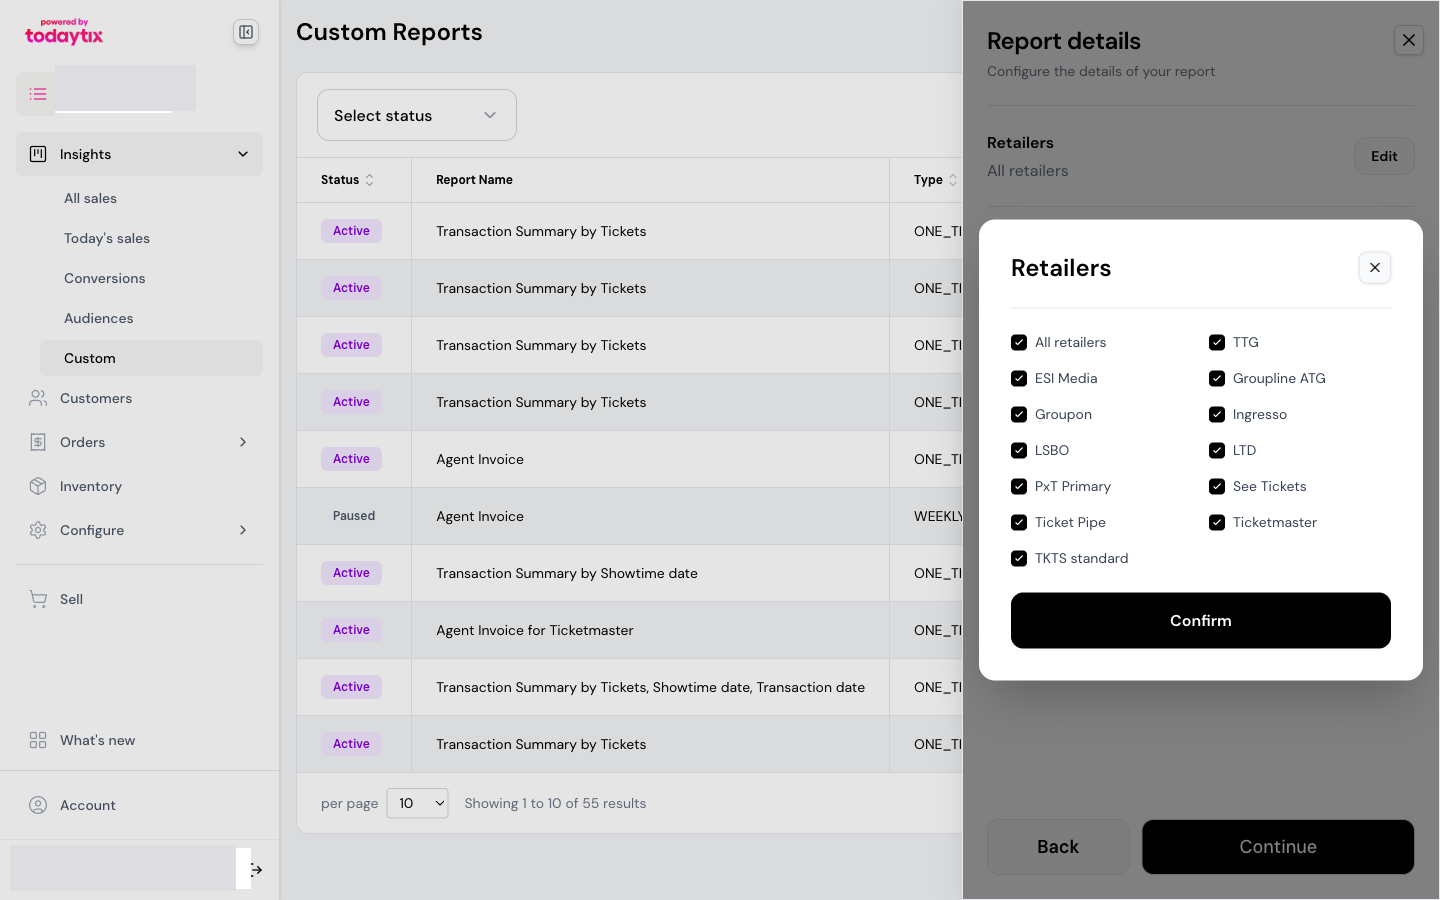
Retailers
By default, all retailers are included. Click Edit to open the retailer picker, where you can select or deselect individual retailers.
Credit card status
Select which transaction statuses to include. All statuses are selected by default — click a pill to toggle it on or off.
Refunds net against their original sale. If you include both Charged and Refunded, the totals reflect the net position. Including all statuses is recommended for most use cases.
Group report by
This determines what each row in your report represents. Select one or more groupings — each generates a separate report table in the same email.
You can select all three to receive a comprehensive set of views in one report.
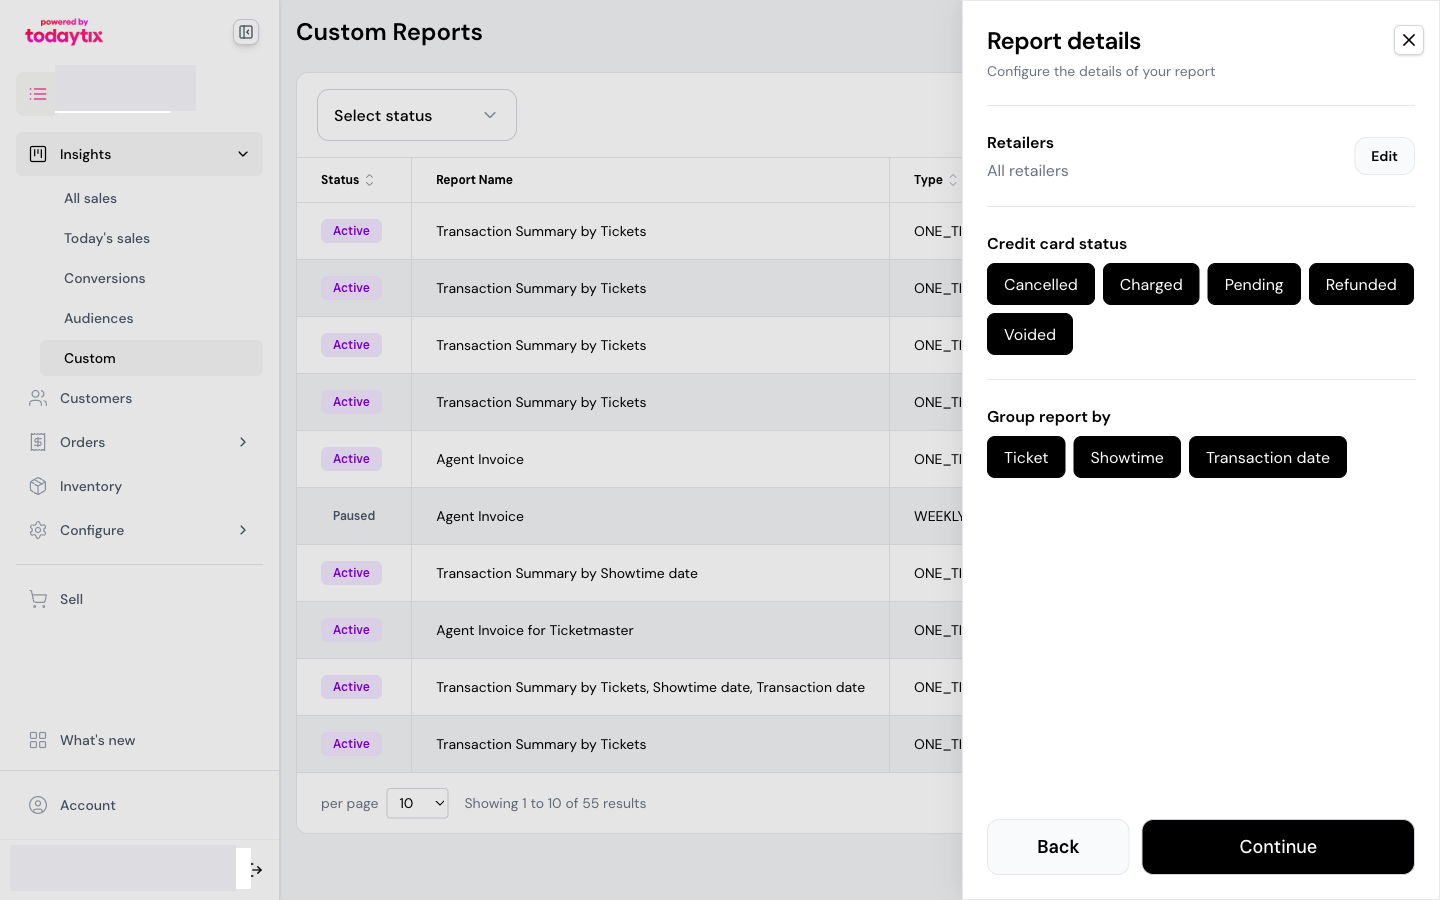
Click Continue to proceed.
Step 3: Report delivery
Choose how and when to receive your report.
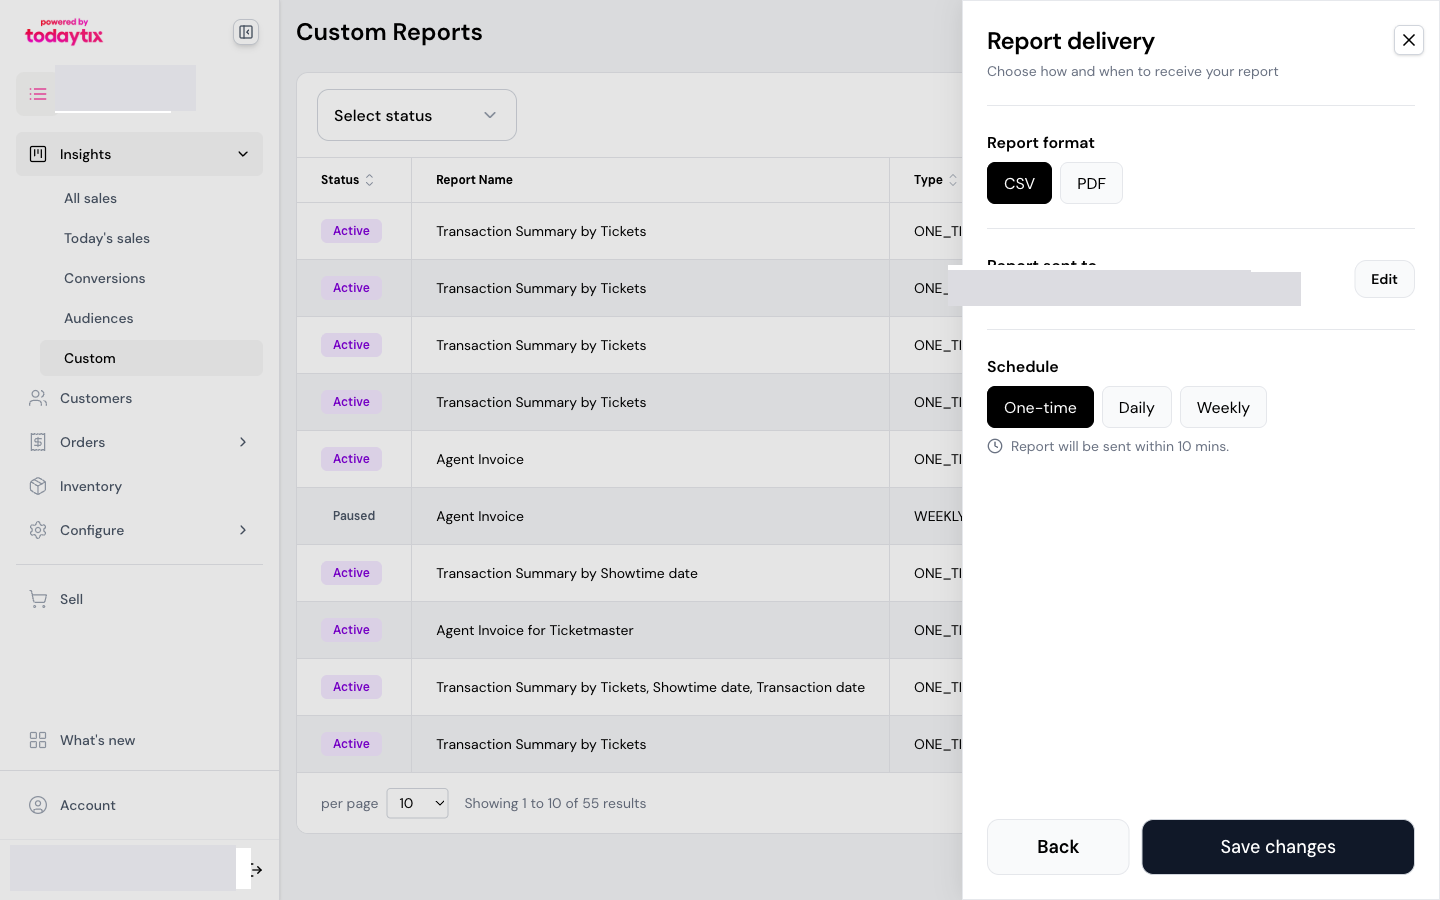
Report format
Select one or both formats.
Report sent to
The report is sent to your email by default. Click Edit to add additional recipients:
- Colleagues who need visibility
- Retailers who want sales updates
Recipients do not need a portal account — they receive the report by email only.
Schedule
Selecting Weekly reveals a day-of-week picker so you can choose which day the report is sent.
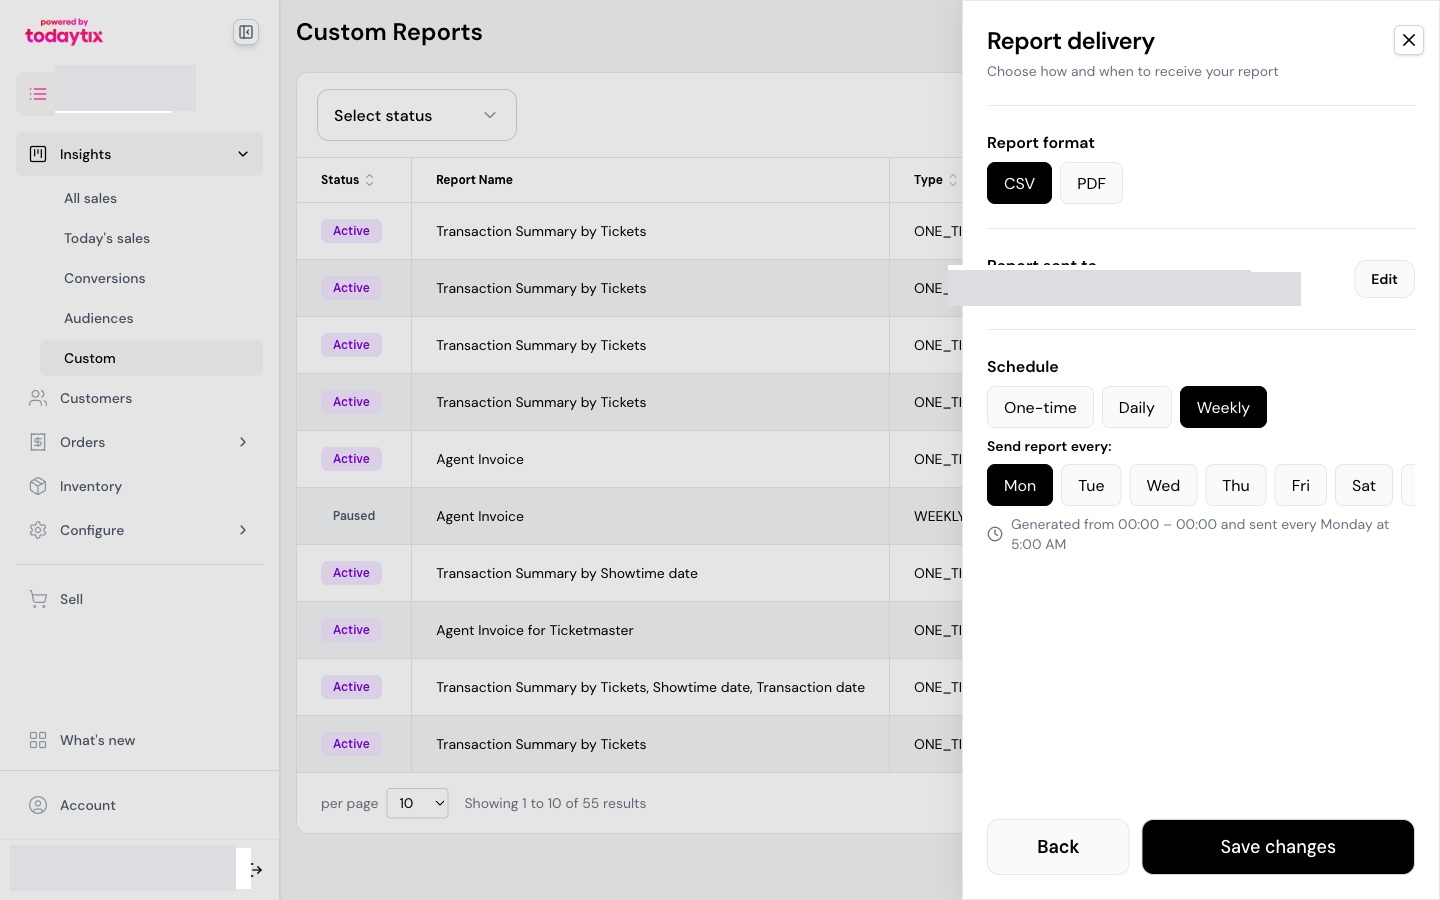
Recurring schedules pair well with day ranges. For example, a weekly report with “previous 7 days” of transactions delivers a rolling weekly summary every Monday.
Save and send
Click Save changes to activate the report. One-time reports arrive within 10 minutes. Scheduled reports begin on their next scheduled send.
Next steps
- Scheduling & Managing Reports — edit, pause, or resume existing reports
- Understanding Report Output — how to read the emailed report
- Report Column Reference — what every column means